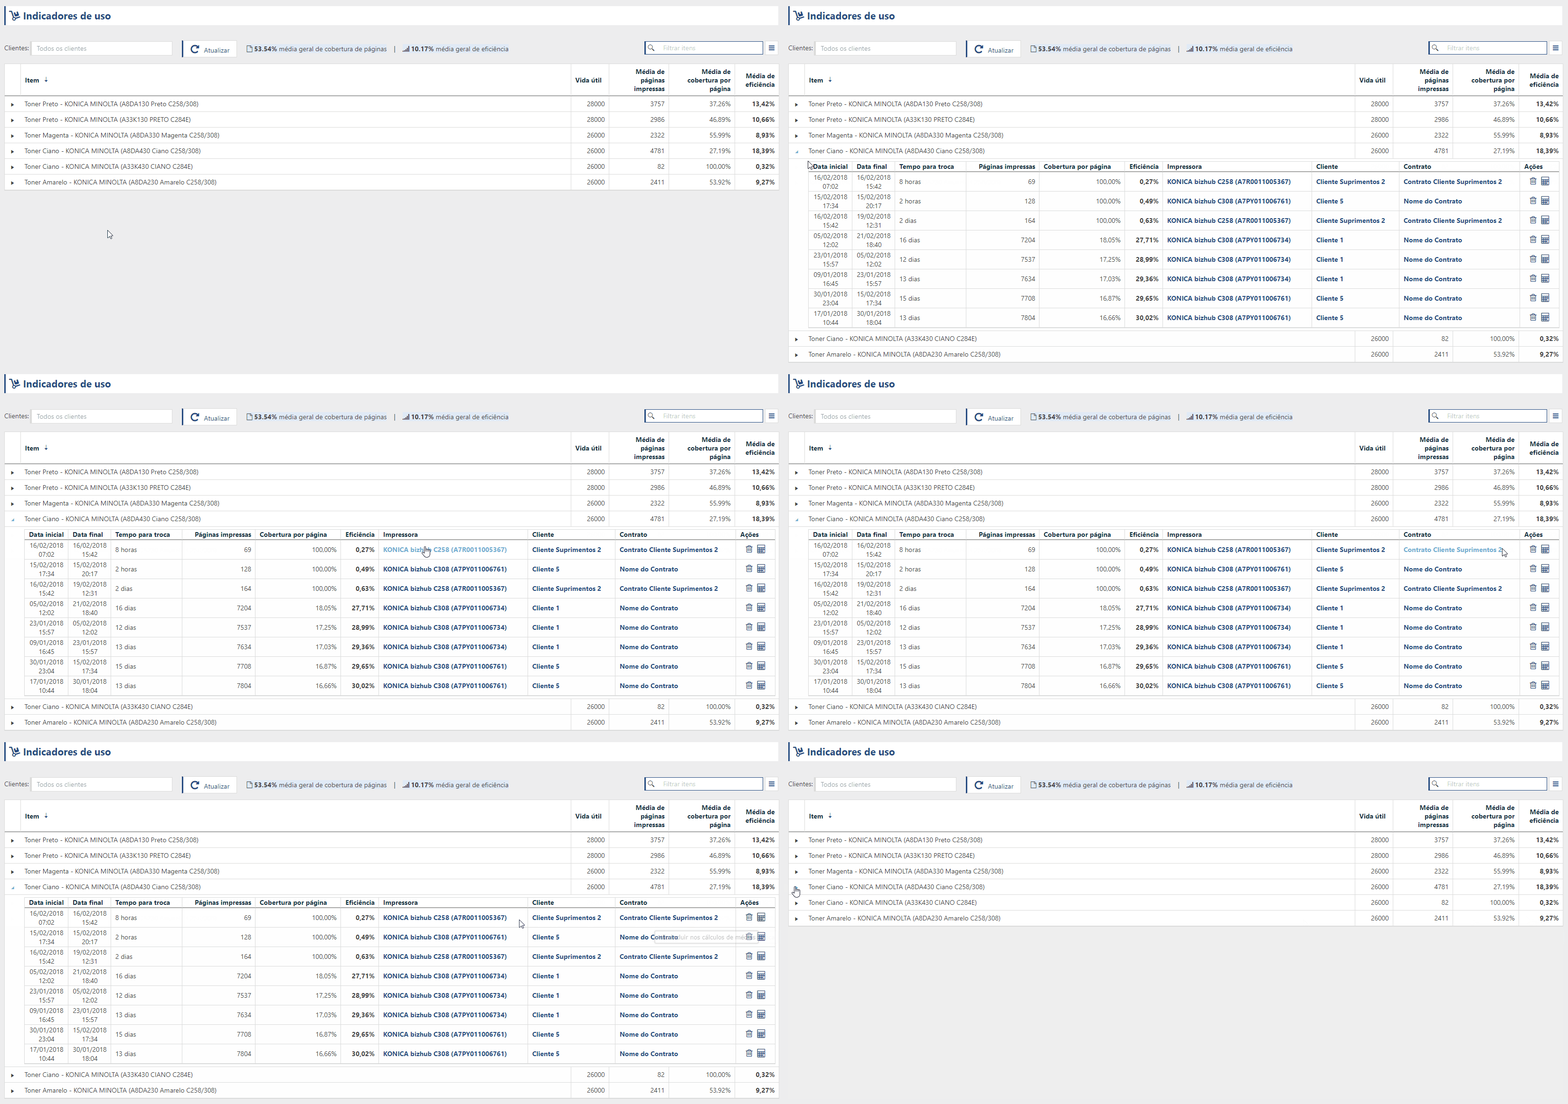
The Usage Indicators screen was created to provide PrintWayy with a detailed display of the average yield for each stock item. This average yield is calculated through the exchanges that have already been confirmed and which were possible to determine the number of pages printed with the item on a specific printer.
Understanding the Indicators screen

General averages
Here the overall average of the filter applied to the table is shown. That is, if a filter of three clients is applied, here will show the average page coverage and efficiency of these three clients combined.
Important:
General averages are only calculated for customer filters and not for item filters.
Media Columns
Here the total item will be averaged, and when expanding the information the exchanges and usage indicators for each exchange individually will be shown.
To better understand how the exchange use indicators are calculated, click here.
Filtering indicators by clients
It is possible to filter the indicators by customers, when you do this filter only the supplies that have already had exchanges made at these customers will appear, and both the average columns and the general averages will be calculated considering only the exchanges of these filtered customers.
To go to Pending Exchange click here.
To go to Exchange Levels and Forecasts click here.
To go to Excluded Exchanges click here.
To go to Confirmed Exchanges click here.
To go to Stock and Stock receipts click here.
To return to the Procurement Management menu, click here.


