
Monitoring Charts

- Number of customers registered in PrintWayy;
- Number of existing printers and also their locations at the moment divided into:
Are on the premises: printers that are monitored in some way;
At your company: printers that are not being monitored;
New printers: printers waiting for the monitoring definition in New Printers. Click here to learn more about this menu. - Status of all monitored printers. Divided into:
With Communication OK: they are with active communication and receiving counters normally;
With CommunicationFault: there is a communication problem and PrintWayy has not been receiving information for some time;
Receiving counters manually: printers manually added by PrintWayy Web and manually inserted counters. - Total numbering of active alerts and divided into Criticality levels. For more details on alert types and criticality levels, click here;
- Total numbering of the calls that are currently open and divided among the possible states. For more details about calls and their possible states, click here;
- Current quantity of pending procurement exchanges. For more details click here.
Page Output Charts
Total pages per month
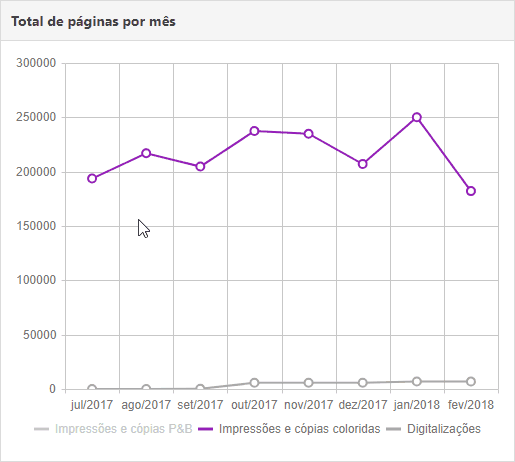 In this graph you can see the total page output of B&W, color and scans for all printers in the month, and you can also activate which type of page output you want to see.
Total pages per day (last 30 days)
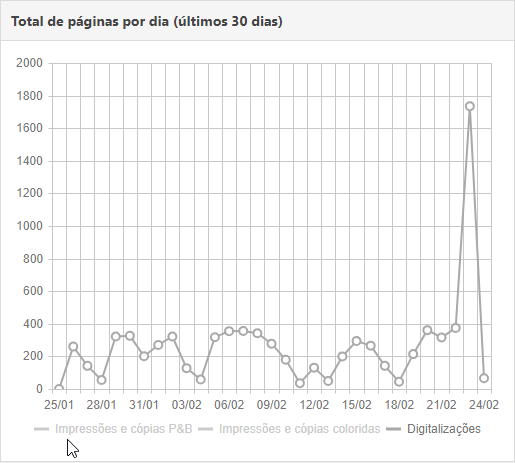
It follows the pattern of the chart above, and you can activate which type of page production you want to view. The difference is that it is always for the last 30 calendar days, so it is updated daily.
Customers who printed the most in the last 30 days
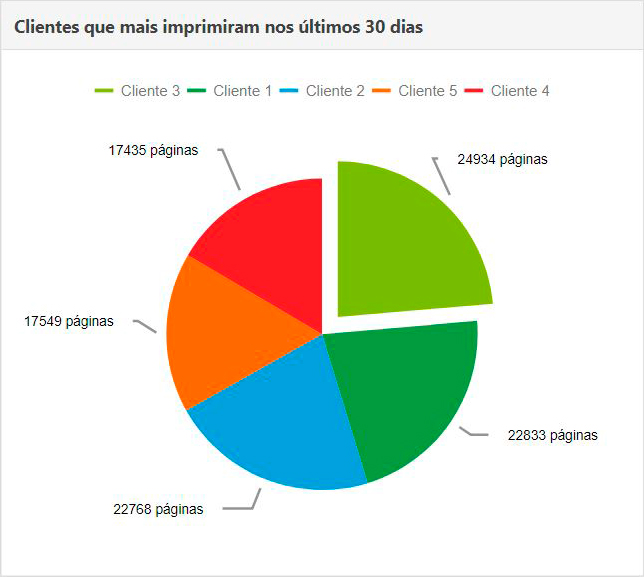
This graph then shows the clients that produced the most pages and also the quantity, relating through the color production-client.
To view customer-specific elements and graphics click here.
To return to the home page of the Panel menu click here.
To return to the Knowledge Base home page click here.