
The Reports menu will list the reports that are currently available to the user. PrintWayy allows three different types of reports to be issued from this menu:
Prints and copies per printer
With the Printouts and Copies by Printer report , you can choose the Client you wish to view the counters, the contract and the period.
Period
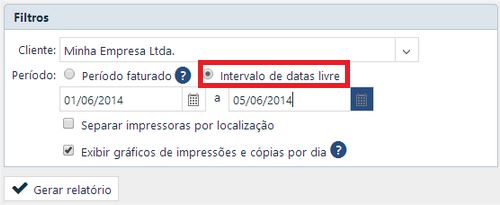
In this report you have two options: Free date range or Billed period. The Free date range option allows any date range to be selected:
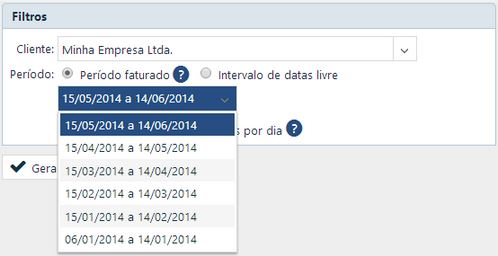
The Billed Period option displays a list of closed monthly periods, which are presented according to the settlement date set in the contract with the provider. In the image below, all periods billed since the beginning of the contract with the provider are presented for the selected customer. Note that the start date of each period is always the 15th of each month, which means that this day is the one that was agreed with the provider at the time of the contract:
Separate printers by location
When a client has more than one location and printers are being monitored, you can separate the location of each one in the report. To do this, simply select the option:
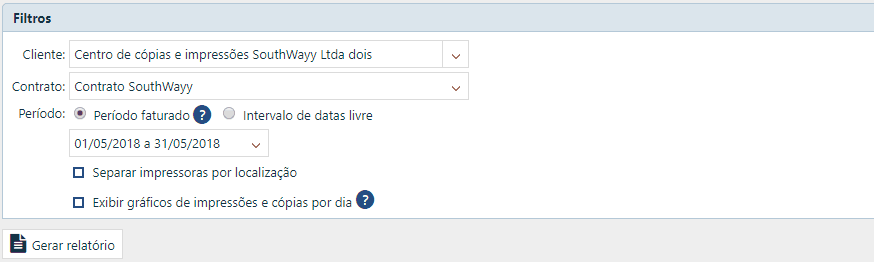
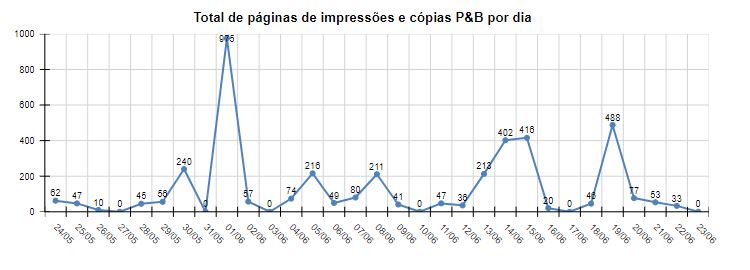
View graphs of prints and copies per day
This option exists to graphically assist the analysis of the counters, but the graphs will only be displayed if a period of maximum 40 days is selected. The graph will exit if the relevant option is selected. An example image of the graph:
Report Column Selection
You can define which columns you want to appear in the generated reports of prints and copies, but this will be defined in the General Settings of your company.
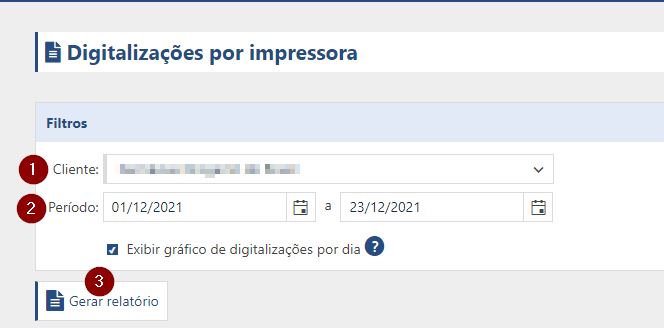
Scans per printer
The report of Scans per Printer only counts the total number of scans made on the equipment of the selected client. To generate the report, select the client, choose the date filter and click Generate Report.
Display graphs of scans per day
As with the Prints and Copies report, this setting does exactly the same thing: Graphics are only displayed if a period of 40 days or less is selected.
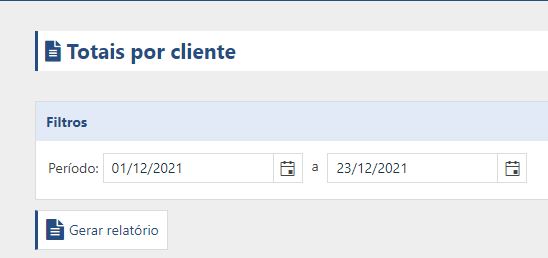
Totals per client
The Totals per Client report shows the total prints/copies and scans for each monitored client, accounting for black and white and colour prints, copies and scans. To generate the report, simply select the date range that should be counted and then click Generate Report.
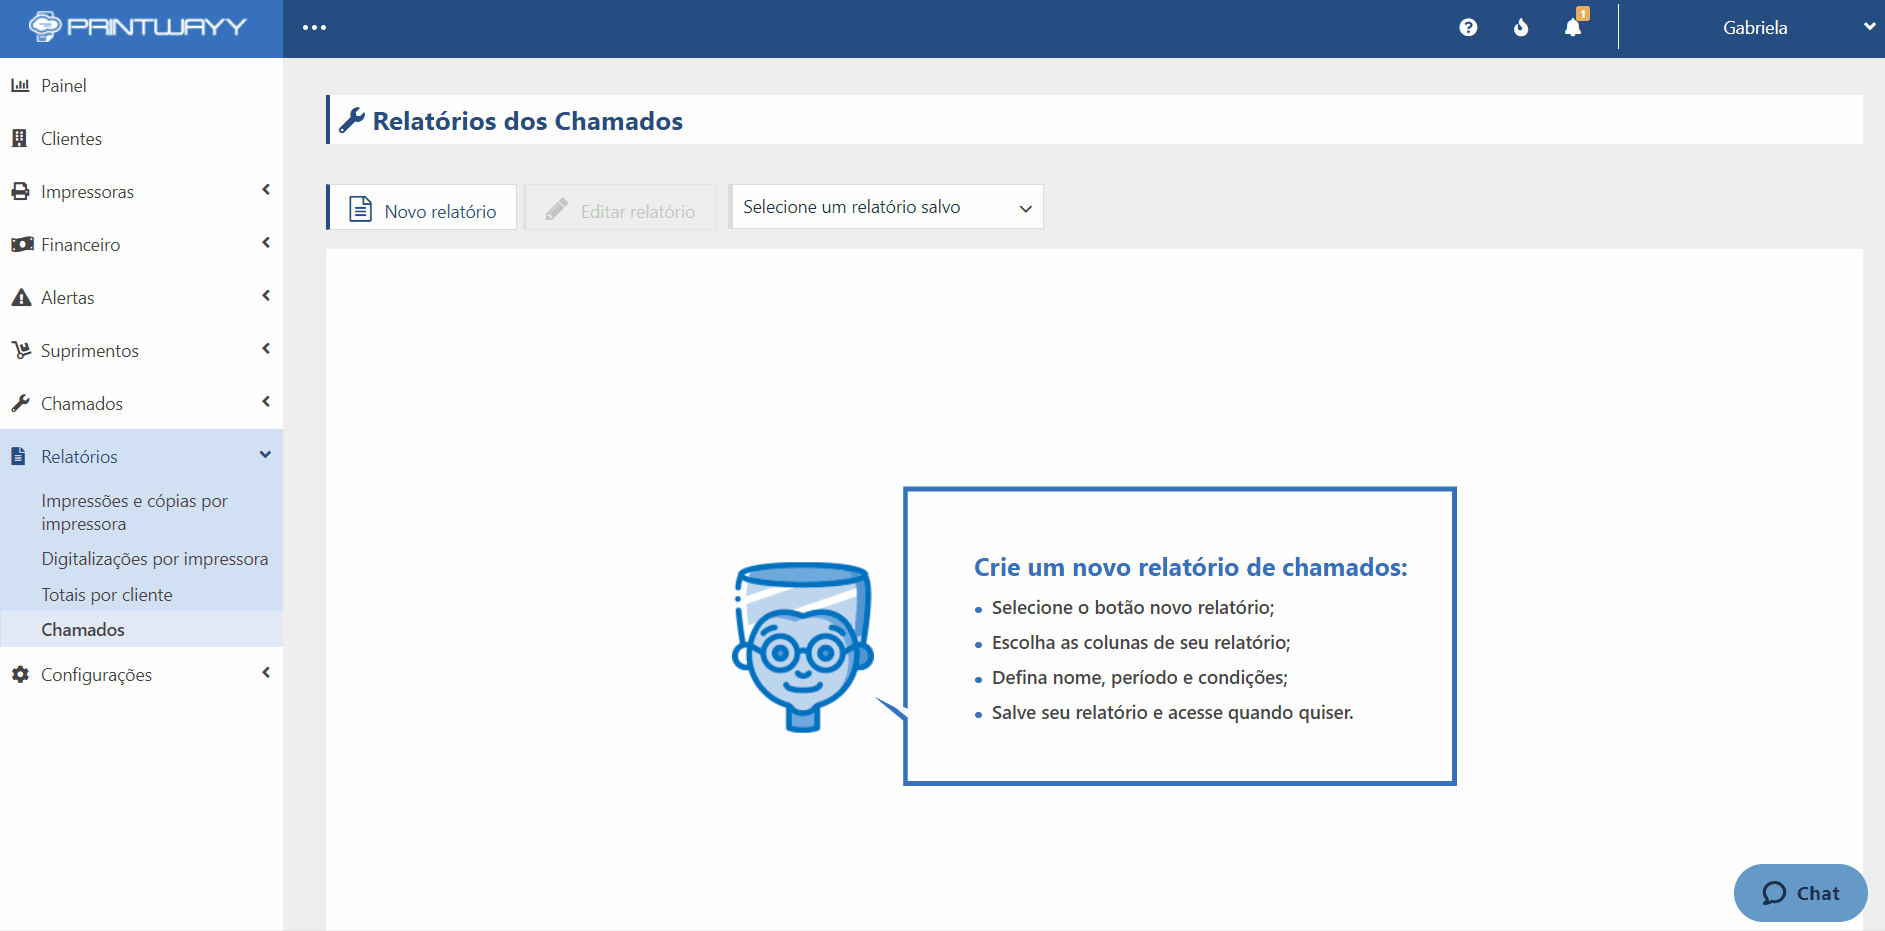
Callers
The call report was created so that you can extract all the information you need to manage your service team.
To access it go to the Reports menu, sub-menu Calls.
In the call report you can:
1 - Choose which columns will be part of the report:
2 - Choose the consultation period and apply filters on the data:
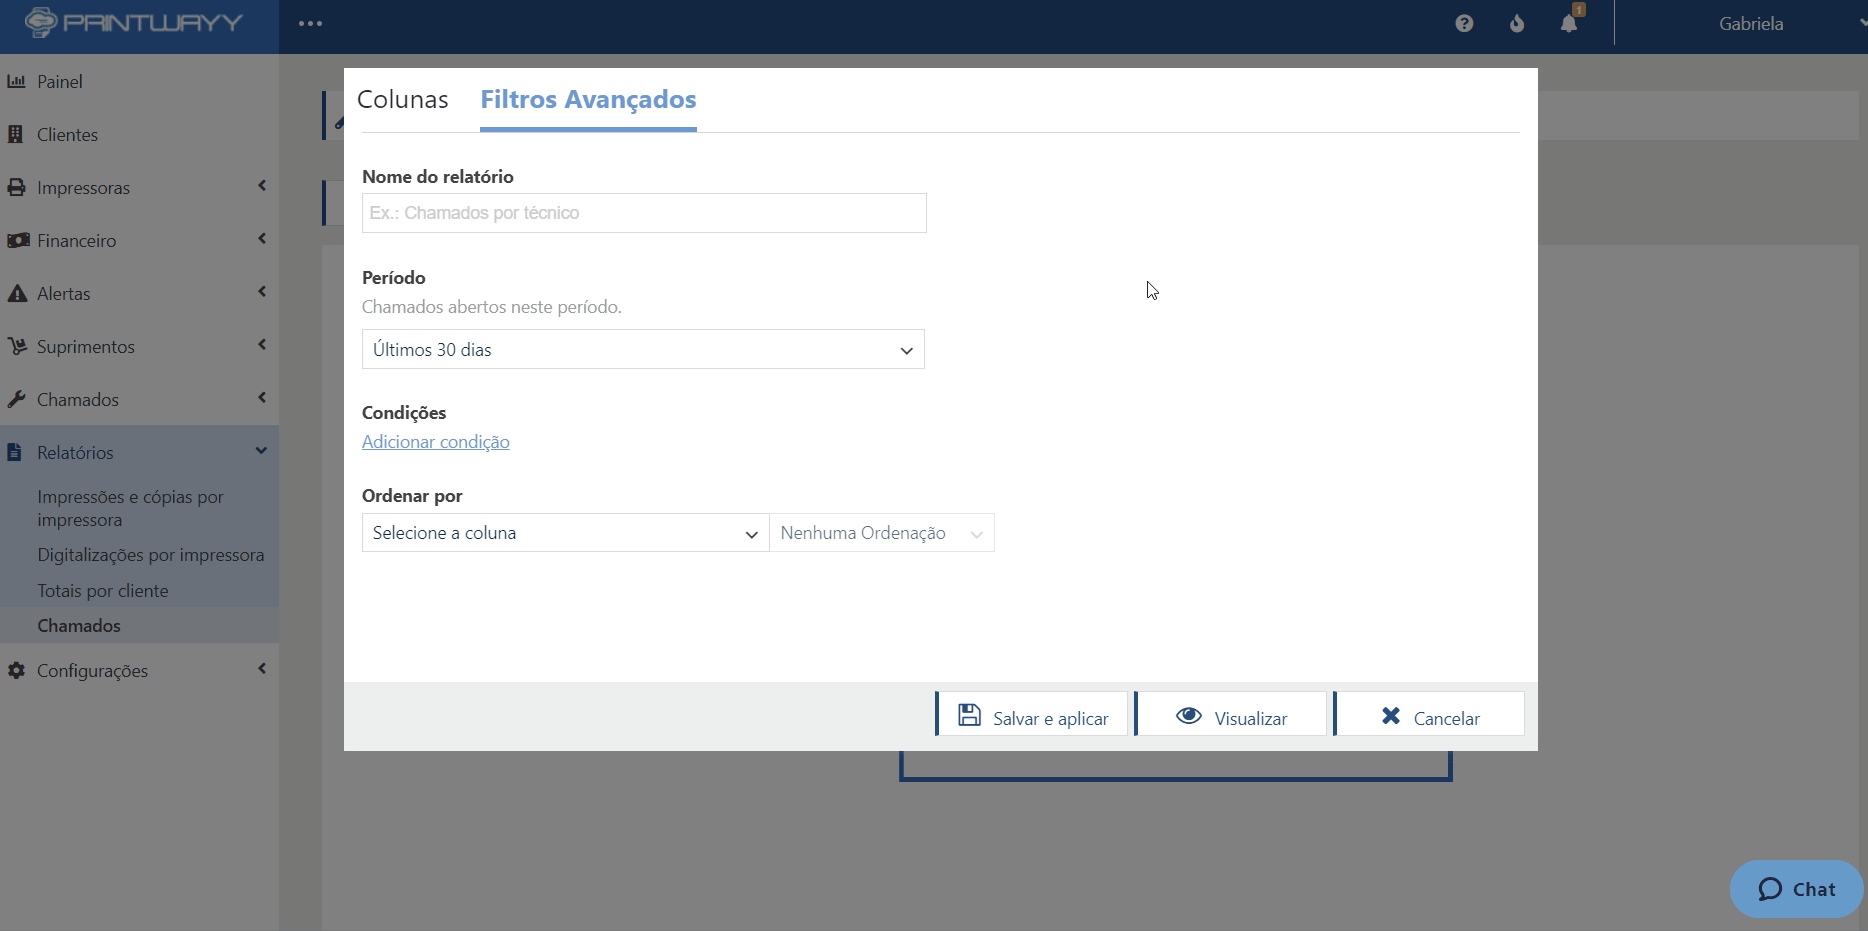
3 - Save the report to view it later;

Watch the demo here.
To return to the Knowledge Base click here.