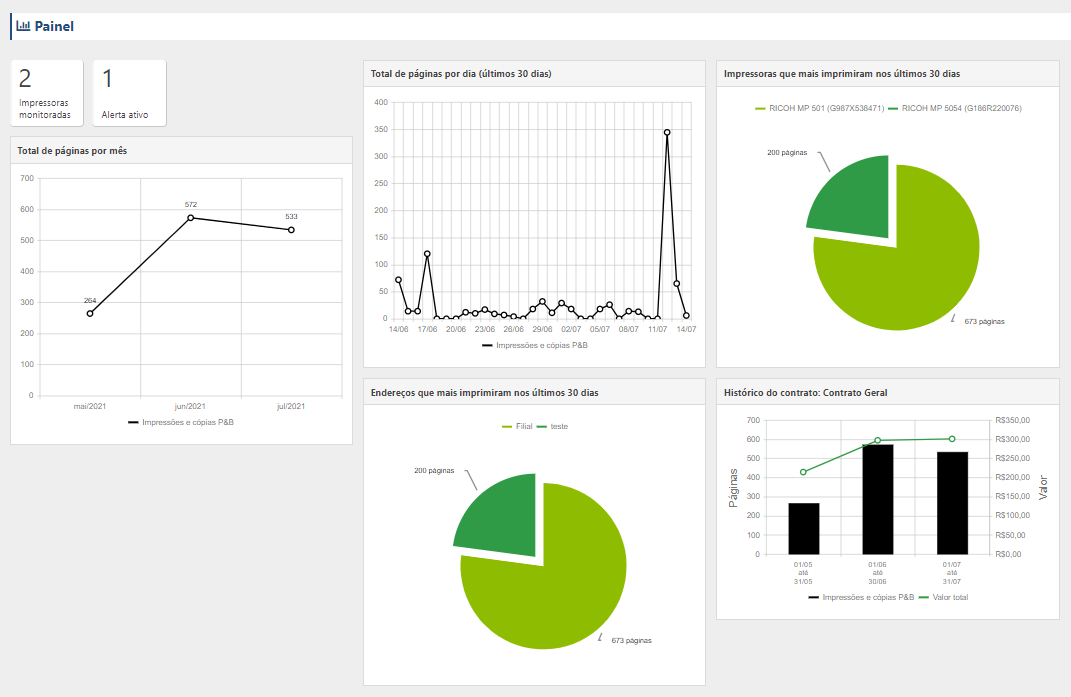
The dashboard displays a summary of the monitoring and data collected by PrintWayy. By clicking on the chart captions, the corresponding information is displayed or hidden from the chart.
See below for details:
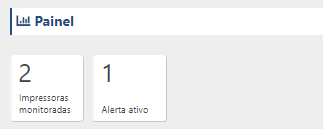
Monitored printers
Total number of printers with monitoring enabled. A click on the box will take you to the printers screen!
Active alerts
Total number of active alerts in the system. Click on the box to be redirected to the active alerts screen.
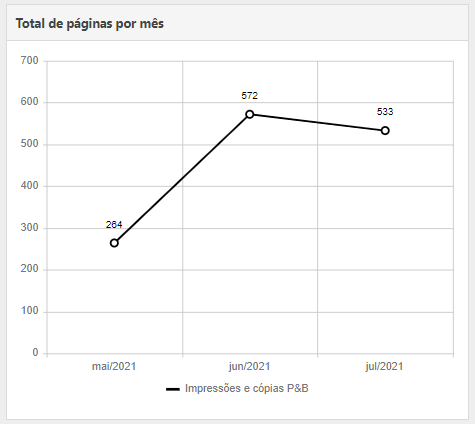
Total pages per month
Graph that displays the total pages produced, sorted by month. Displays total pages in B&W, colour and scans.
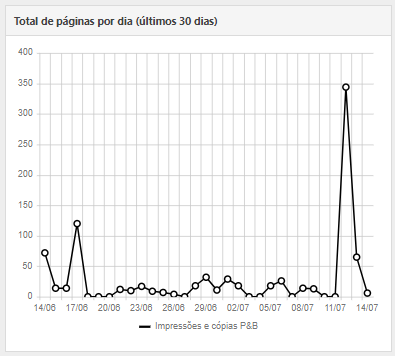
Total pages per day
Graph displaying the total pages produced daily by all printers for the last 30 days.
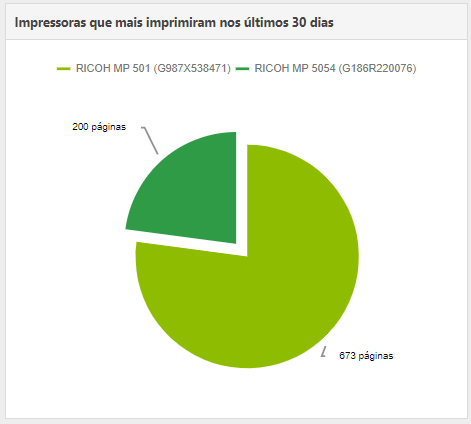
Printers who printed the most in the last 30 days
This chart shows a ranking of the printers that printed the most in the last 30 days, considering B&W and colour pages.
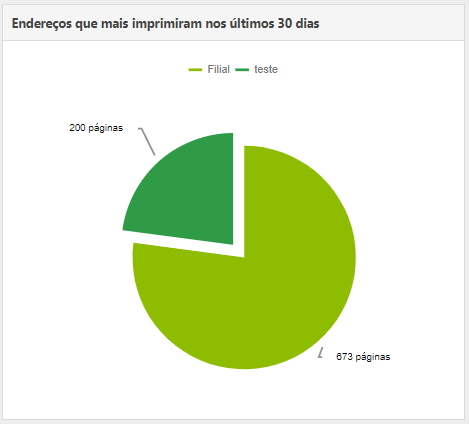
Addresses that printed the most in the last 30 days
This chart shows a ranking of the addresses that have printed the most in the last 30 days, considering B&W and colour pages.
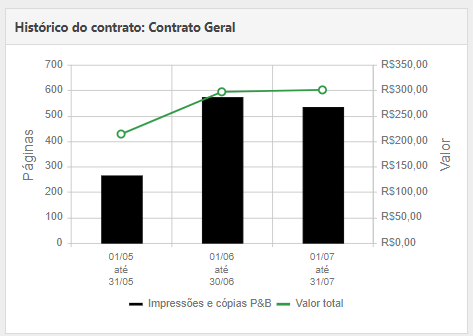
Contract History
This graph shows the history of contracts from month to month, with information on value, number of pages and month in force.