
Customer Information
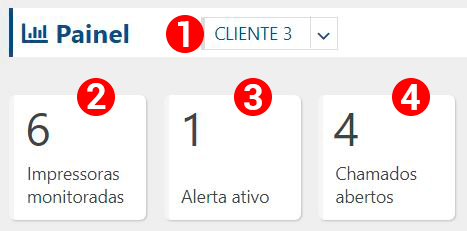
- Selecting the client to view the information;
- Number of printers monitored at the chosen client;
- Number of active alerts existing on monitored printers on the chosen client;
- Number of active calls for this customer.
Customer Pages Production Charts
Total pages per month
Dynamic graph specifying the page output per month of the monitored printers at the selected client.
Total pages per day (last 30 days)
It is possible, as with all graphics, to activate which type of page production you want to view. The difference is that it is always for the last 30 calendar days, and is updated daily.
Addresses that printed the most in the last 30 days
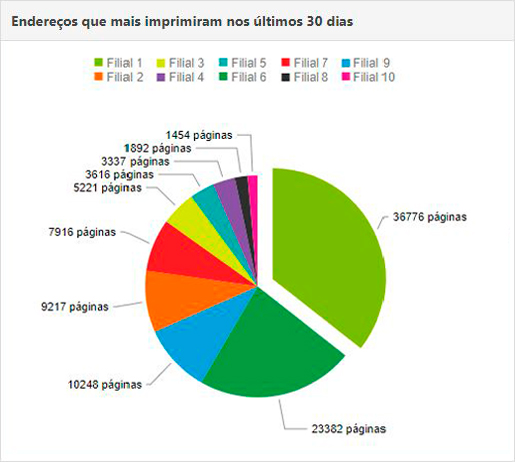
If you have a customer with several branches/addresses and this information is registered in PrintWayy in the Customers menu, you can view this graph, informing the number of pages produced in the period of 30 calendar days, updating the information daily. You must also link the addresses to the monitored printers.
Printers that printed the most in the last 30 days
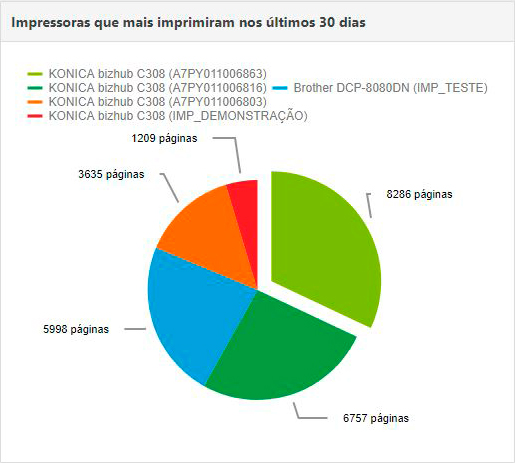
Chart shows the printers that have printed the most in the last 30 calendar days for the specific customer, regardless of address or contract.
Contract History
If you register contracts through the Financial menu, it will be possible to follow through the months the income of this contract, checking the total value of the closure on the page production and type of accountant.
To view the elements and graphics for all clients click here.
To return to the home page of the Panel menu click here.
To return to the Knowledge Base home page click here.